How-to · Developer
How to record a bug report in Chrome with console and network logs
The short answer
Click record, reproduce the bug, then stop — the extension captures the screen, console, network requests and your repro steps into one shareable bundle. Sensitive values are auto-redacted, and everything is built locally in the browser.
- 1
Open the recorder and press record.
- 2
Reproduce the bug — console, network and your steps are captured together.
- 3
Review the capture; sensitive values are auto-redacted before sharing.
- 4
Stop and export one shareable bundle to attach to a ticket.
“It works on my machine” usually means the bug report was missing context. A good report needs the console errors, the failing network calls, and the exact steps — not just a screenshot. In Chrome you can capture all of that in one pass and hand over a single file.
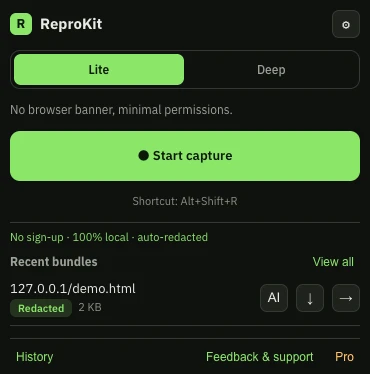
Start recording, then reproduce the bug
Open the recorder and press record. Now do the thing that breaks — click through the flow, submit the form, trigger the error. The extension captures the console output, the network requests and responses, and your steps as you go.
Review and redact before you share
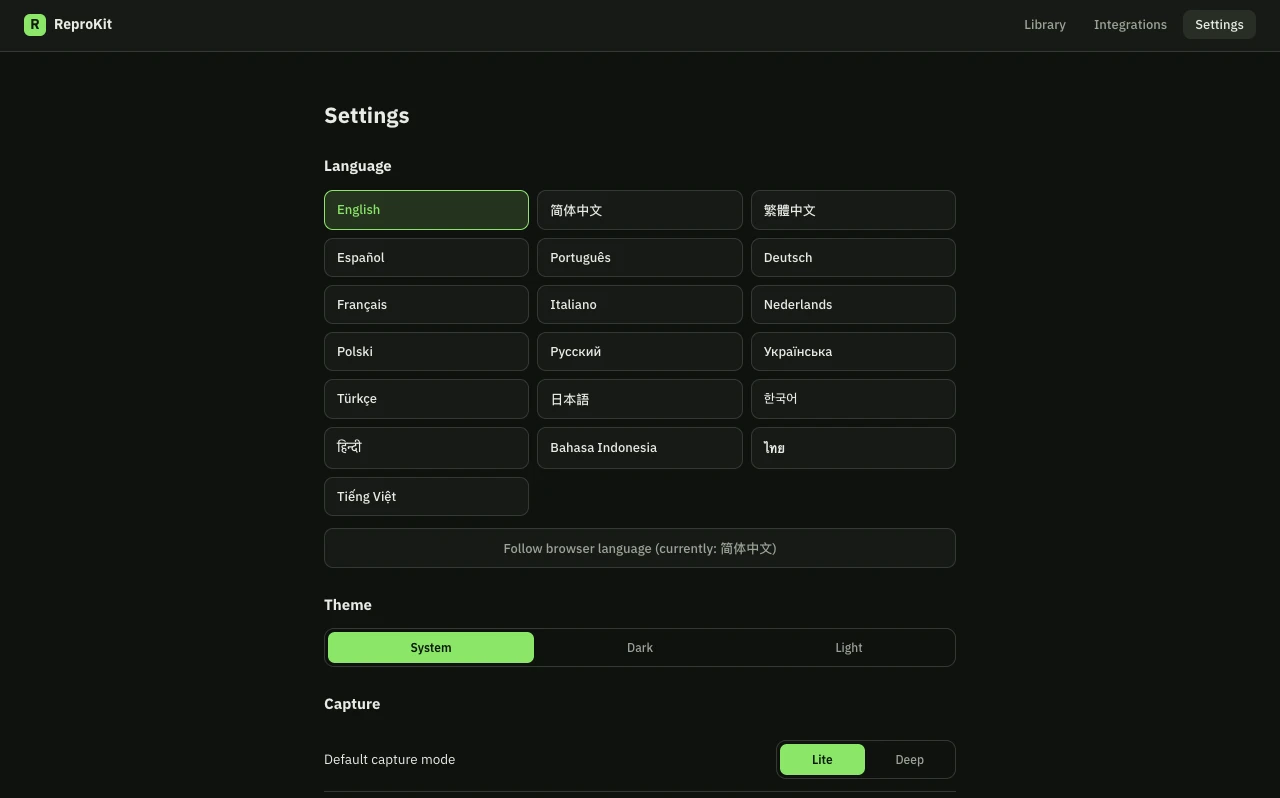
Sensitive values — tokens, auth headers, cookies — are auto-redacted, and you can review the capture before it leaves your hands. Tune what’s included and what’s masked in settings so a shared bundle never carries a secret.
Export one shareable bundle
Stop the recording and the extension assembles a single bundle with the screen recording, console log, network log and repro steps. Send that to a teammate or attach it to a ticket — they get the full picture, not a lone screenshot.
Built locally, redacted by default
ReproKit is local-first: the bundle is assembled in your browser and auto-redacted, with no all-sites access required. Nothing is uploaded unless you choose to share it.